The notion of a function is important for the modularity and scalability of program analyses. For some applications, like control-flow integrity, functions represent an indispensable abstraction. Functions are well-defined in the source code and easy to identify in non-stripped binaries. However, identifying functions in stripped binaries can be challenging.
This motivated several works, including our CASES'16 paper, to tackle this problem. In this article, I revisit this problem with two goals in mind. First, overviewing the state of the art in a systematic way. Second, discussion and quantification of the (often overlooked) role that call frame information can play as a source of function definitions.
What is a binary-level function?
Before delving into function identification techniques, the notion of a binary-level function needs to be defined in first place. Functions are well-defined constructs in the source code. For example, a couple of curly braces can clearly mark the scope of a function in C/C++. However, things are not that straightforward when we move to binary-level functions. Compiler optimizations such as function inlining and splitting can substantially alter how functions are laid out in the binary. This caused a discrepancy in the research community on how functions are defined.
Generally, binary-level functions are defined based on two models; they are the contiguous and chunk models. In the former, a function simply occupies a single contiguous code region. The latter model, on the other hand, aims for more generality by allowing a function to span multiple chunks. Each chunk in turn is a contiguous code region. The chunk model might be motivated by a need to maintain the mapping between a single source-level function and its corresponding chunks in the binary, which can be many. As a result, a single chunk might be shared between several functions. This model is adopted in tools like Dyninst and nucleus.
The contiguous model has its adopters, too. In "efficient binary-level coverage analysis" (accepted to ESEC/FSE 2020), we show that despite its irresistible simplicity, the contiguous model is consistent with the functions defined in the symbol table in our large corpus of x86-64 binaries. Here, consistency means that we observed that two key assumptions generally hold. First, most basic blocks in the function's region are reachable from its entry (reachability). Second, functions do not target arbitrary basic blocks inside each other, rather only their respective entries (encapsulation). Reachability and encapsulation are important properties for the modularity of program analyses that build on functions as a core abstraction.
There is a twist, however. We allowed a single function to have multiple entry points. This was necessary for the accurate treatment of constructs such as C++ exceptions. In this way, we leveraged the simplicity of the contiguous model without loss in generality. That said, our discussion will only focus on this model. It defines a function by its boundaries; start and end addresses. This definition can be augmented with a set of entry and exit points which determine where control-flow can enter or leave the function respectively.
Haven’t we solved this problem yet?
Identifying functions in non-stripped binaries is straightforward; just read the symbol table. Therefore, our attention is focused on the more interesting case of identifying functions in stripped binaries. The techniques proposed for addressing this problem can be broadly categorized to manual pattern matching, machine learning, and CFG-based techniques.
Functions prologues and epilogues often contain instructions for stack setup and
tear down respectively.
Manually writing heuristics for detecting such patterns is not difficult.
For example, a heuristic that looks for the pushes can provide a rough approximation of function starts. However, heuristics being heuristics, they can only take us so far.
Pattern matching can be automated using machine learning. This research theme has been considered in several works. The beginning was with Rosenblum et al. who leveraged conditional random fields. Other notable works include ByteWeight which relies on weighted prefix trees, and Shin et al. who decided to go for recurrent neural networks instead.
The effectiveness of a machine learning technique is measured by its ability to generalize beyond its training set. However, modern compiler optimizations are diverse and sophisticated. Additionally, optimizations are conducted at all levels. From a single compilation unit up to whole-program link-time optimization. Add to this post-link optimization which is witnessing a recent revival like Facebook's BOLT. All of this makes function identification by learning byte-level features quite challenging to generalize.
This leaves us with CFG-based identification techniques. In our CASES'16 paper, we proposed to leverage the control flow graph (CFG) to identify functions. Basically, we partition a global CFG, which is recovered after disassembly, to a call graph connecting multiple function-level CFGs. It seems that the time was ripe for such ideas. In the following year not one, but two similar CFG-based proposals were published. They are Nucleus which appeared in Euro S&P'17 and Function Interface Analysis in DSN'17. In the latter, the authors incorporated additional data-flow analyses.
What all of these proposals have in common are the following key mechanisms:
-
Call target analysis. Collects the targets of direct calls as a first step to identify function entries.
-
CFG traversal. Traverse a function's CFG to determine its end address. This is the end of the last basic block reachable from the entry.
-
Tail-call target analysis. Direct jumps targeting regions outside the current function are considered tail-calls which are used to identify the entries of more functions.
The first mechanism is independent and can be done in one pass. The remaining two can be iteratively applied until a fix point is reached, i.e., no more function entries to discover.
CFG-based identification is practical and highly accurate with consistent results across all of the aforementioned works. These results motivated binary ninja to quickly adopt it. So can we say that the problem is now solved? I would say that it is solved to a significant extent, but certainly not entirely.
The main issue here is that we rely on the ability to traverse the CFG in the second step. However, the recovered CFG might not be precise enough for our purpose. I can provide some concrete examples which might prove challenging:
-
Adjacent functions. Consider two adjacent functions A and B. The latter is either indirectly called or not called at all. A tail-call from A to B is indistinguishable in this case from a usual intra-procedural jump. Hence, both functions will be merged in a single function.
-
Non-return functions. Should a function end with a call to an undetected non-return function, then it is possible to continue the CFG traversal stepping into the following function. Some non-return functions are well-known like
exitandabort. However, detecting non-return functions generally requires analyzing the call-graph. However, building the call-graph depends in turn on having function definitions already. This leads to a cyclical dependency. -
Inter-procedural conditionals. Compilers never fail to surprise especially when it comes to undefined behavior. Consider the implementation of
llvm_unreachable(see LLVM programmer's manual). In a debug build, it will print an error message and terminate with a call toabort. All good so far. In a release build, however, it will hint to the compiler that there is no need to generate code since reaching such a statement is undefined behavior. In this case, the compiler might decide to emit a conditional jump at the end of the function which if not satisfied, will branch into the next function, whatever that is. We do not have access to such hints in the binary which can lead us to continue the CFG traversal.
Of course, this list is by no means exhaustive. Also, issues can coincide to further complicate matters. For example, having too many indirect calls in the binary which might reduce the quality of the call target analysis in the first step. Nevertheless, I think that, in practice, it is safe to expect CFG-based identification to be able to recover well over 90% of the functions.
Are stripped binaries really stripped?
We looked at function identification assuming that if the symbol table is stripped, then we have no alternative but to analyze the binary itself. This assumption might have been valid in the old days of ebp based stack unwinding in x86. However, it is generally not valid anymore in x86-64, or perhaps other ISAs for that matter.
Nowadays, call frame information (CFI) records are embedded in the majority of commercial off-the-shelf binaries. They are the basis of the modern stack unwinding mechanism used in C++ exception handling. However, there are several good reasons for including CFI records in C programs as well like generating backtraces. This SO answer provides more examples.
CFI records can be found in the eh_frame section which is part of the loadable binary image. You can dump them using something like,
$ readelf --debug-dump=frames /bin/ls
The output shows some Common Information Entry (CIE) records encapsulating many Frame Description Entry (FDE) records like the one in this example,
00000048 0000000000000024 0000001c FDE cie=00000030 pc=0000000000003770..0000000000003e70
  DW_CFA_def_cfa_offset: 16
  DW_CFA_advance_loc: 6 to 0000000000003776
  DW_CFA_def_cfa_offset: 24
  DW_CFA_advance_loc: 10 to 0000000000003780
  DW_CFA_def_cfa_expression (DW_OP_breg7 (rsp): 8; DW_OP_breg16 (rip): 0; DW_OP_lit15; DW_OP_and; DW_OP_lit11; DW_OP_ge; DW_OP_lit3; DW_OP_shl; DW_OP_plus)
  DW_CFA_nop
  DW_CFA_nop
  DW_CFA_nop
  DW_CFA_nop
This FDE record defines a function in the region from pc=0000000000003770 to 0000000000003e70 which are start and end addresses respectively. This is the only bit of information of concern to us. The cryptic expressions prefixed with DW_ can be used by a debugger like gdb to restore register values during stack unwinding.
I move now to do some hands-on experimentation with CFI records. My goal is to first quantify the existence of the .eh_frame section in practice. More important, to see to what extent the functions defined in .eh_frame section are complete. After all, an .eh_frame with only a handful of function definitions is not that useful. Note the developers might deliberately omit CFI records of some functions to save space.
For this experiment which was conducted on a typical Ubuntu 18.04 installation, I searched all default executable and library paths, like /usr/bin and /lib, looking for ELF binaries.
I managed to find 5,538 ELF binaries in total. An .eh_frame section did exist in all of those binaries. Having established the existence of function definitions, the question is now to what extent are they complete?
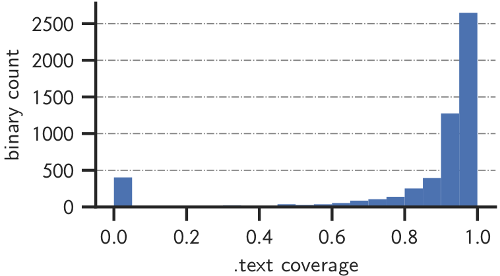
In order to measure the completeness of functions defined in the .eh_frame, I sum their sizes and then divide that sum by the size of the .text section. I exclude the few functions located in other sections. The result is a metric that I will refer to as function coverage ratio. Intuitively, a coverage ratio of 100% means that all code in .text lies within functions defined already, i.e., more functions can not exist. However, data bytes are often embedded in the .text section. For example, padding bytes which are used to align function starts. Therefore, a ratio greater than 95% can be deemed to achieve full coverage.
The distribution of the coverage ratio for this dataset is depicted below.
About 400 binaries have a coverage ratio of less than 5%. Many of which have empty .eh_frame sections with no FDEs at all. On the other hand, we have a comfortable majority of about 4,000 binaries (72% of total) with coverage ratio of more than 90%.
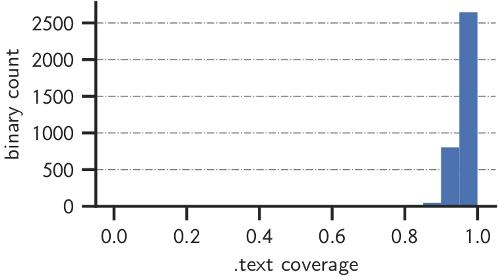
My dataset is somewhat comprehensive but not necessarily representative of the binaries that are "relevant". In order to obtain a more representative dataset, I omitted system binaries found in the paths /usr/lib/syslinux, /usr/lib/klibc, and /usr/lib/debug/. I also omitted smaller binaries which have a .text section of size less than 4KB. This results in a dataset of 3,574 binaries that I deemed to be "relevant”.
The coverage ratio distribution is now quite different as shown in the figure below. The overall trend is clear. CFI records are mostly complete in larger user-space binaries. Admittedly, relevance here is a subjective criteria.
Conclusion
I will simply conclude with a short, cookbook style, recommendation. Look for CFI records, if available, and measure their function coverage ratio. If the ratio is insufficient for your application, then add to the mix one (or more) of the CFG-based mechanisms. Be cautious about CFG imprecision as it might introduce issues during traversal.
I'm interested in your take on this piece. Please reach out by opening an issue in this repository.